ma12lt1
Author:
Paul
Last Updated:
7 yıl önce
License:
Creative Commons CC BY 4.0
Abstract:
long test

\begin
Discover why over 25 million people worldwide trust Overleaf with their work.
long test

\begin
Discover why over 25 million people worldwide trust Overleaf with their work.
\documentclass[11pt]{article}

\usepackage{amsmath,amssymb,amsfonts}
\usepackage{graphicx}

\setlength{\topmargin}{-.5in} \setlength{\textheight}{9.25in}
\setlength{\oddsidemargin}{0in} \setlength{\textwidth}{6.8in}


\begin{document}

\Large


\noindent{\bf Ma 12 Long Test 1\hfill 9 February 2017}


\medskip\hrule
\begin{enumerate}

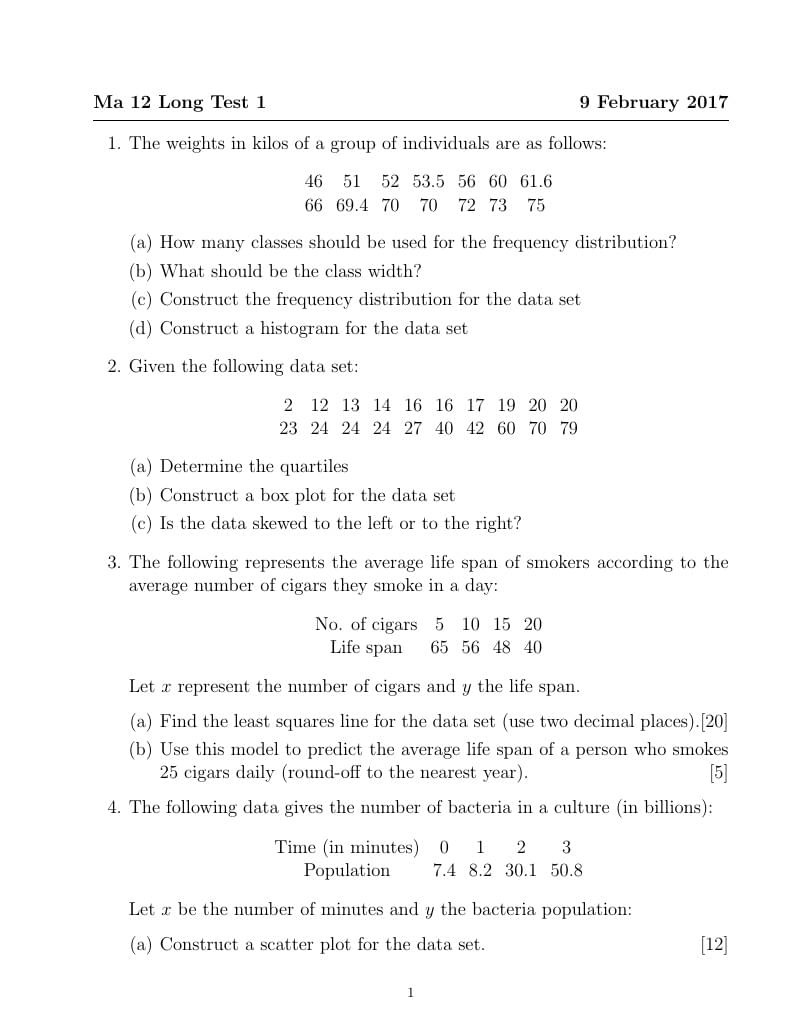
\item The weights in kilos of a group of individuals are as follows:
\begin{center}
$%
\begin{array}{ccccccc}
46 & 51 & 52 & 53.5 & 56 & 60 & 61.6  \\
66 & 69.4 & 70 & 70 & 72 & 73 & 75 %
\end{array}%
$
\end{center}
\begin{enumerate}
    \item How many classes should be used for the frequency distribution?
    \item What should be the class width?
    \item Construct the frequency distribution for the data set
    \item Construct a histogram for the data set
\end{enumerate}


\item Given the following data set:
 \begin{center}
$%
\begin{array}{cccccccccc}
2 & 12 & 13 & 14 & 16 & 16 & 17 & 19 & 20 & 20  \\
23 & 24 & 24 & 24 & 27 & 40 & 42 & 60 & 70 & 79 %
\end{array}%
$
\end{center}

\begin{enumerate}
    \item Determine the quartiles
    \item Construct a box plot for the data set
    \item Is the data skewed to the left or to the right?
\end{enumerate}

\item The following represents the average life span of  smokers according to the average number of cigars they smoke in a day:
\begin{center}
$%
\begin{array}{ccccc}
\text{No. of cigars} & 5 & 10 & 15 & 20
\\
\text{Life span} & 65 & 56 & 48 & 40 %
\end{array}%
$
\end{center}
Let $x$ represent the number of cigars and $y$ the life span.
\begin{enumerate}
\item Find the least squares line for the data set (use two decimal places).\hfill[20]

\item Use this model to predict the average life span of a person who smokes 25 cigars daily (round-off to the nearest year).\hfill[5]

    \end{enumerate}

\item The following data gives the number of bacteria in a culture  (in billions):
   \begin{center}
    $%
\begin{array}{ccccc}
\text{Time (in minutes)} & 0 & 1 & 2 & 3 \\
\text{Population} & 7.4 & 8.2 & 30.1 & 50.8%
\end{array}%
$
\end{center}

Let $x$ be the number of minutes  and $y$ the bacteria population:
\begin{enumerate}
\item Construct a scatter plot for the data set.\hfill[12]
\item Does the data follow a linear trend?
\item Linearize the data set

\item Find the least squares line for the linearized data set \hfill[8]

\item Predict the bacteria population after 10 minutes.\hfill[5]


Note: Answers should be correct to four decimal places for this item.

\end{enumerate}

\begin{center}
$m=\dfrac{n\sum xy -\sum x\sum y}{n\sum x^2 -(\sum x)^2}$

$b=\dfrac{\sum x^2\sum y - \sum x\sum xy}{n\sum x^2 -(\sum x)^2}$

\end{center}


\end{enumerate}

\end{document}